
The places with the largest climatic changes need not be those where future
conditions extend furthest beyond a species' current climatic range.
climniche measures local climate change alongside movement towards or away
from the species' average climate and the distance beyond its estimated
climatic range.


Website: https://bohao0813.github.io/climniche/
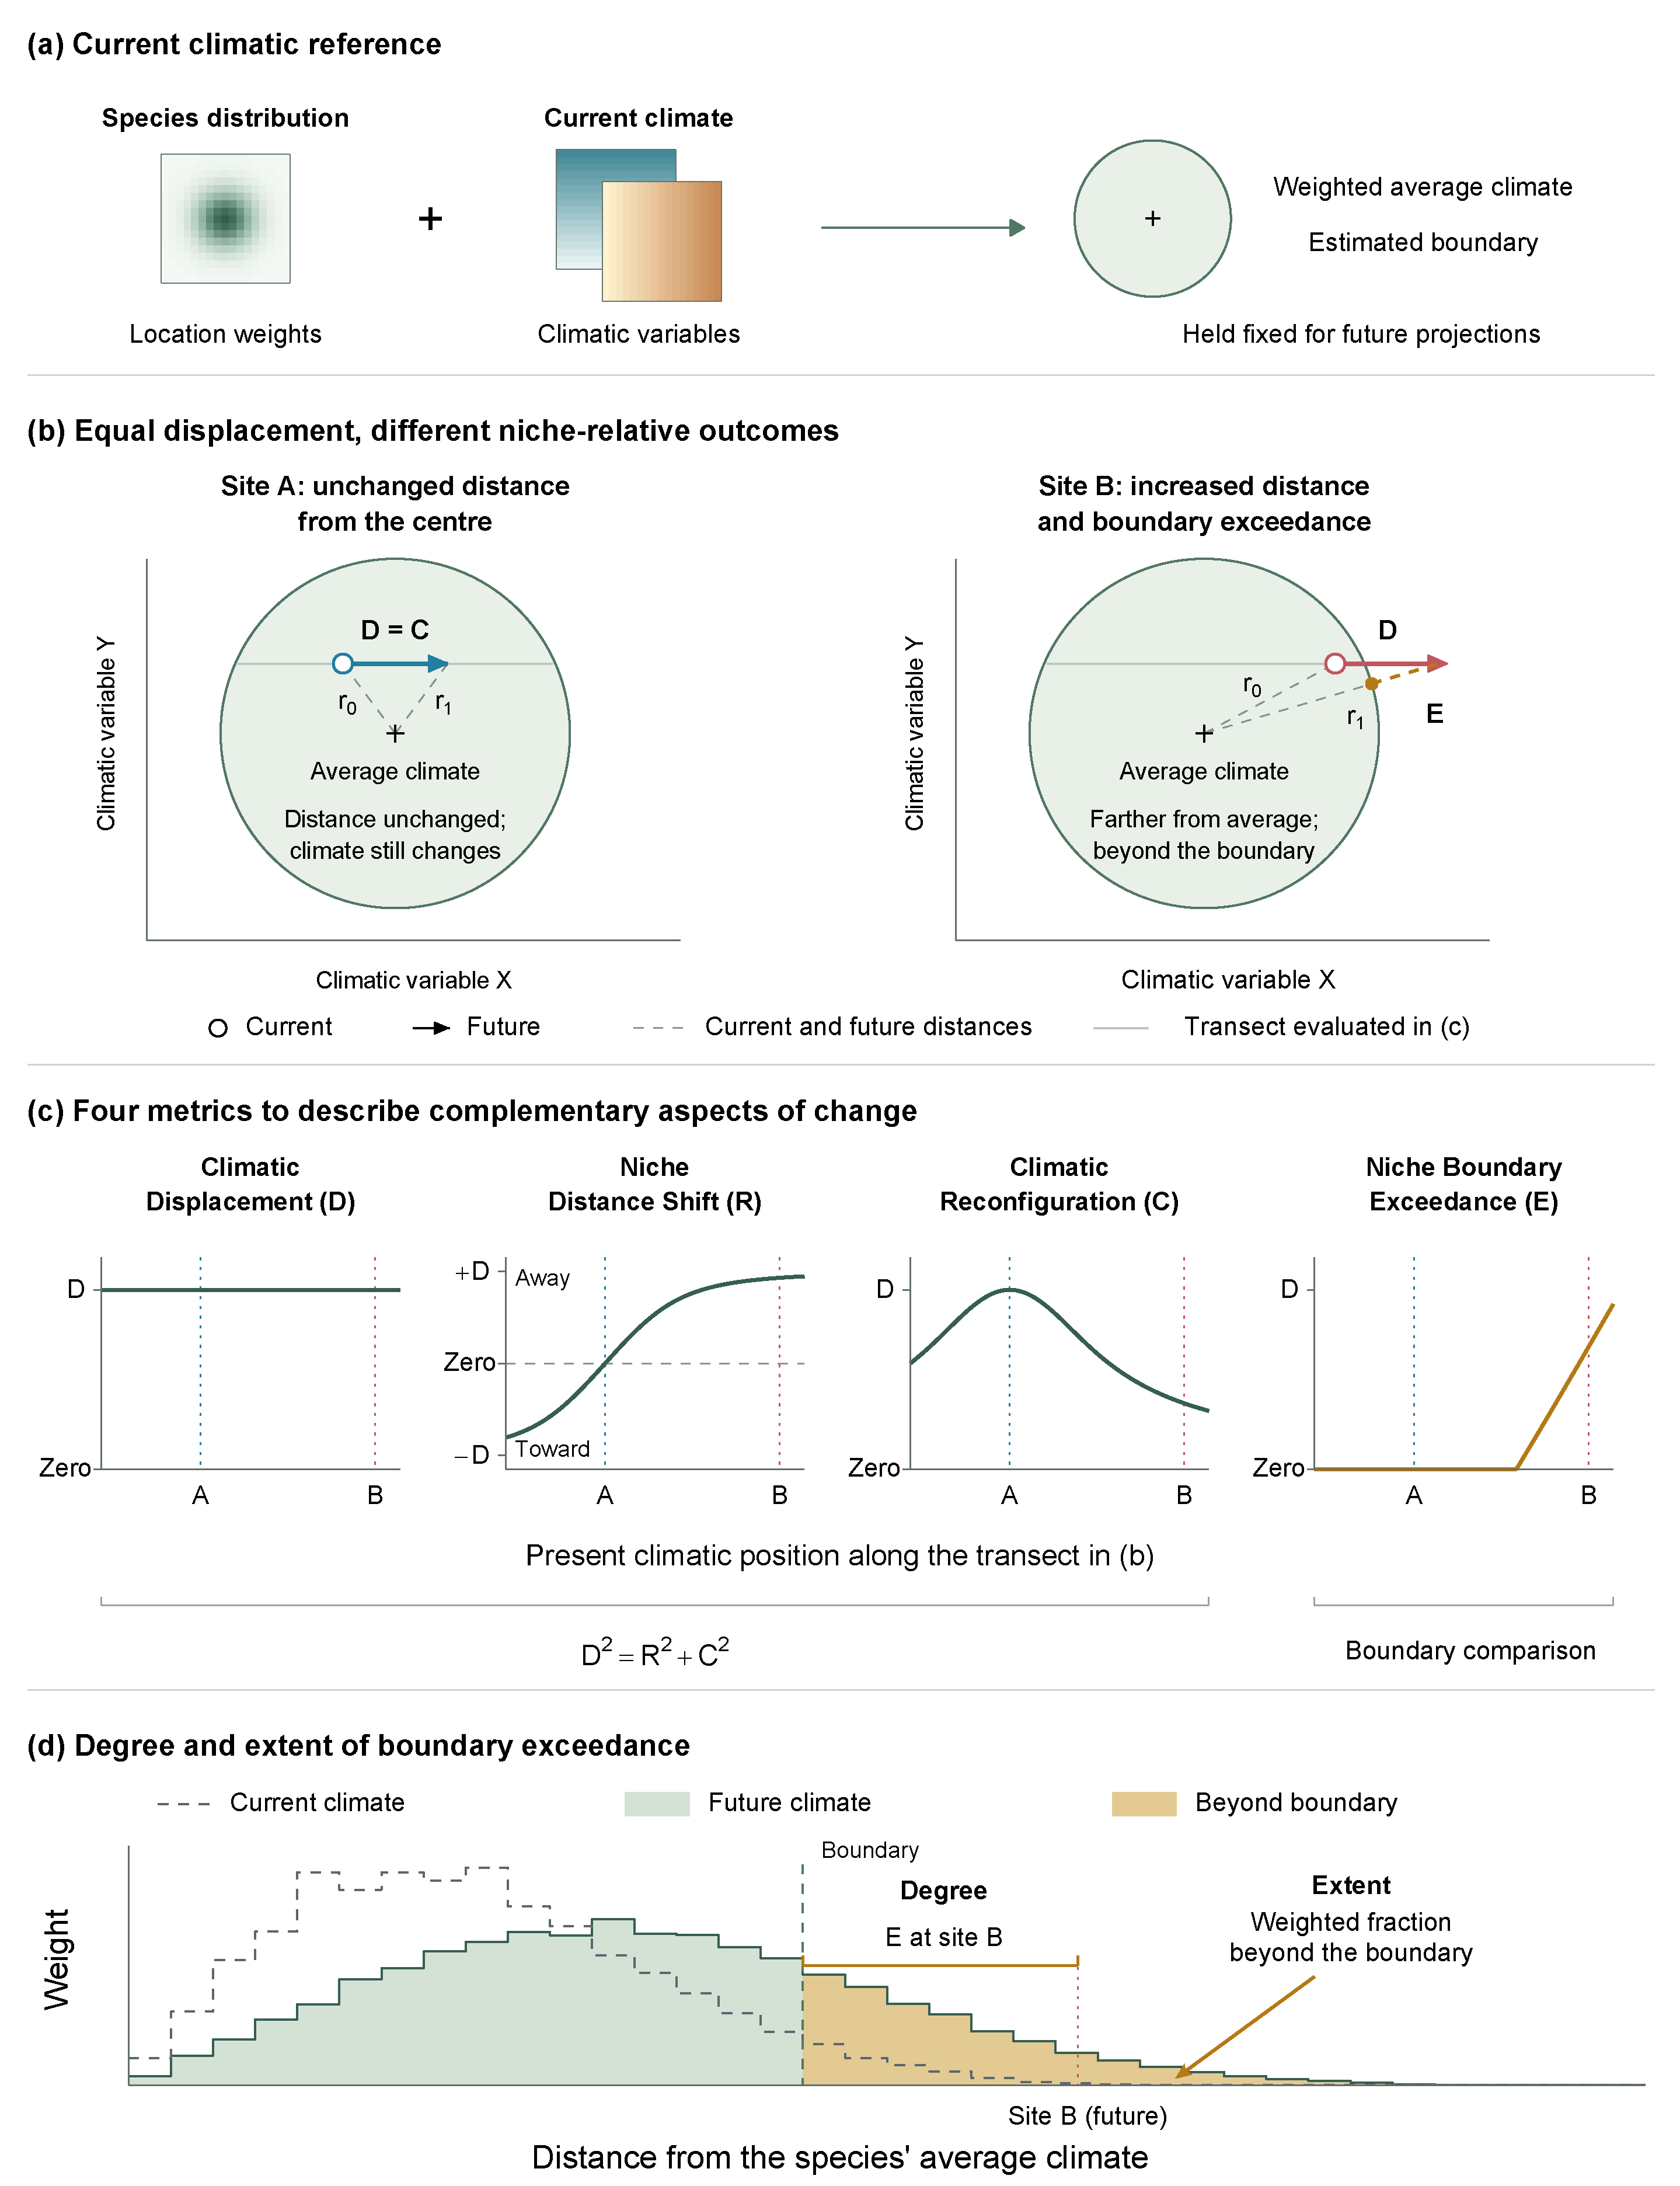
Equal climatic change, different exposure. A conceptual example calculated with climniche; calculation and interpretation.
Install the CRAN release:
install.packages("climniche")
Install the development version from GitHub:
install.packages("remotes")
# remotes::install_github("Bohao0813/climniche")
install.packages("climniche", repos = c('https://bohao0813.r-universe.dev', 'https://cloud.r-project.org'))
A species' current distribution describes the climates it encounters.
climniche summarises these conditions by a weighted average and an estimated
climatic range, called the empirical climatic niche reference. This
reference remains fixed when future conditions are evaluated.
climate_change_amount): the amount of climatic
change at a location, measured as the distance between present and future climate.niche_distance_change): signed change in distance
from the weighted average climate. Negative values indicate movement towards
this average; positive values indicate movement away.climate_reconfiguration): the part of climatic
displacement not expressed as a change in distance from that average.niche_boundary_exceedance): the distance by
which future conditions exceed the estimated climatic range. It is zero
at or within the boundary.Every input interface follows the same four steps.
fit_climniche() accepts numeric matrices and data frames.
fit_climniche_raster() accepts RasterLayer, RasterStack and RasterBrick
objects, whereas fit_climniche_terra() accepts SpatRaster objects. A fitted
reference can also be created with fit_climniche_reference() and reused with
project_climniche().
library(climniche)

# Generate example climates and a current distribution.
sim <- simulate_climniche()

# Compare present and future conditions at the same locations.
fit <- fit_climniche(
  current = sim[["current"]],
  future = sim[["future_away"]],
  occupied = sim[["occupied"]],
  sensitivity = sim[["sensitivity"]]
)

# Summarise exposure within the current distribution.
climniche_summary(fit)
climniche_report(fit, species = "example species")
plot_climniche_summary_figure(fit)
Location weights can represent occurrence records, range maps, binary SDMs or
continuous suitability. The raster interfaces accept binary and continuous
reference rasters. occupied_threshold sets values at or below the cutoff to
zero and retains larger values as continuous weights. domain limits the
analysis to a study region; study_region adds its outline to maps.
fit_climniche_series() uses the same current climatic reference across future
periods. This allows the extent and degree of boundary exceedance to be
compared through time.
# Create four illustrative future projections.
future <- lapply(c(0.25, 0.50, 0.75, 1), function(fraction) {
  sim[["current"]] + fraction *
    (sim[["future_away"]] - sim[["current"]])
})

series <- fit_climniche_series(
  current = sim[["current"]],
  future = future,
  time = c(2030, 2050, 2070, 2090),
  occupied = sim[["occupied"]],
  sensitivity = sim[["sensitivity"]]
)

climniche_range_summary(series)
departure <- climniche_departure(series)
plot_climniche_time(series)
climniche_range_summary() separates how much of the weighted distribution
lies beyond the boundary from how far those conditions extend beyond it.
climniche_departure() records the first supplied projection beyond the
boundary and the fraction of projections with exceedance. Consecutive runs
can be examined with persistence.
climniche_priority() compares one exposure quantity with habitat suitability
or another ecological criterion. Two-objective Pareto ranking can help locate
potential exposure hotspots or guide the search for climatic refugia.
The current location weight is the default second criterion. Supply
criterion to use another quantity, such as abundance or habitat condition.
The anchovy comparison
pairs continuous SDM suitability with larger positive Niche Distance Shift or,
in a separate analysis, with smaller Climatic Displacement. The output retains
both criteria, Pareto ranks and mapped depth scores.
climniche_dominant_contribution() identifies the climate variable with the
largest absolute contribution to squared niche distance change at each cell. Its
dominance share measures how much of the total absolute contribution is
assigned to that variable. These terms decompose the squared-distance change
underlying Niche Distance Shift; they are not SDM variable importance.
contribution <- climniche_dominant_contribution(fit)
summary(contribution)
For a spatial fit, plot_climniche_dominant_contribution() maps the dominant
variable and its share within the selected reference cells.
The European anchovy example asks whether the largest climatic changes occur where future conditions lie beyond the species' estimated climatic range in the Mediterranean Sea. Companion examples follow exposure from 2030 to 2090, identify climatic variables contributing to spatial differences, and compare exposure with habitat suitability.
Contributions are welcome. Please make a pull request or contact bohao.he@polimi.it.